| 111 Proteins |
|---|
Applications
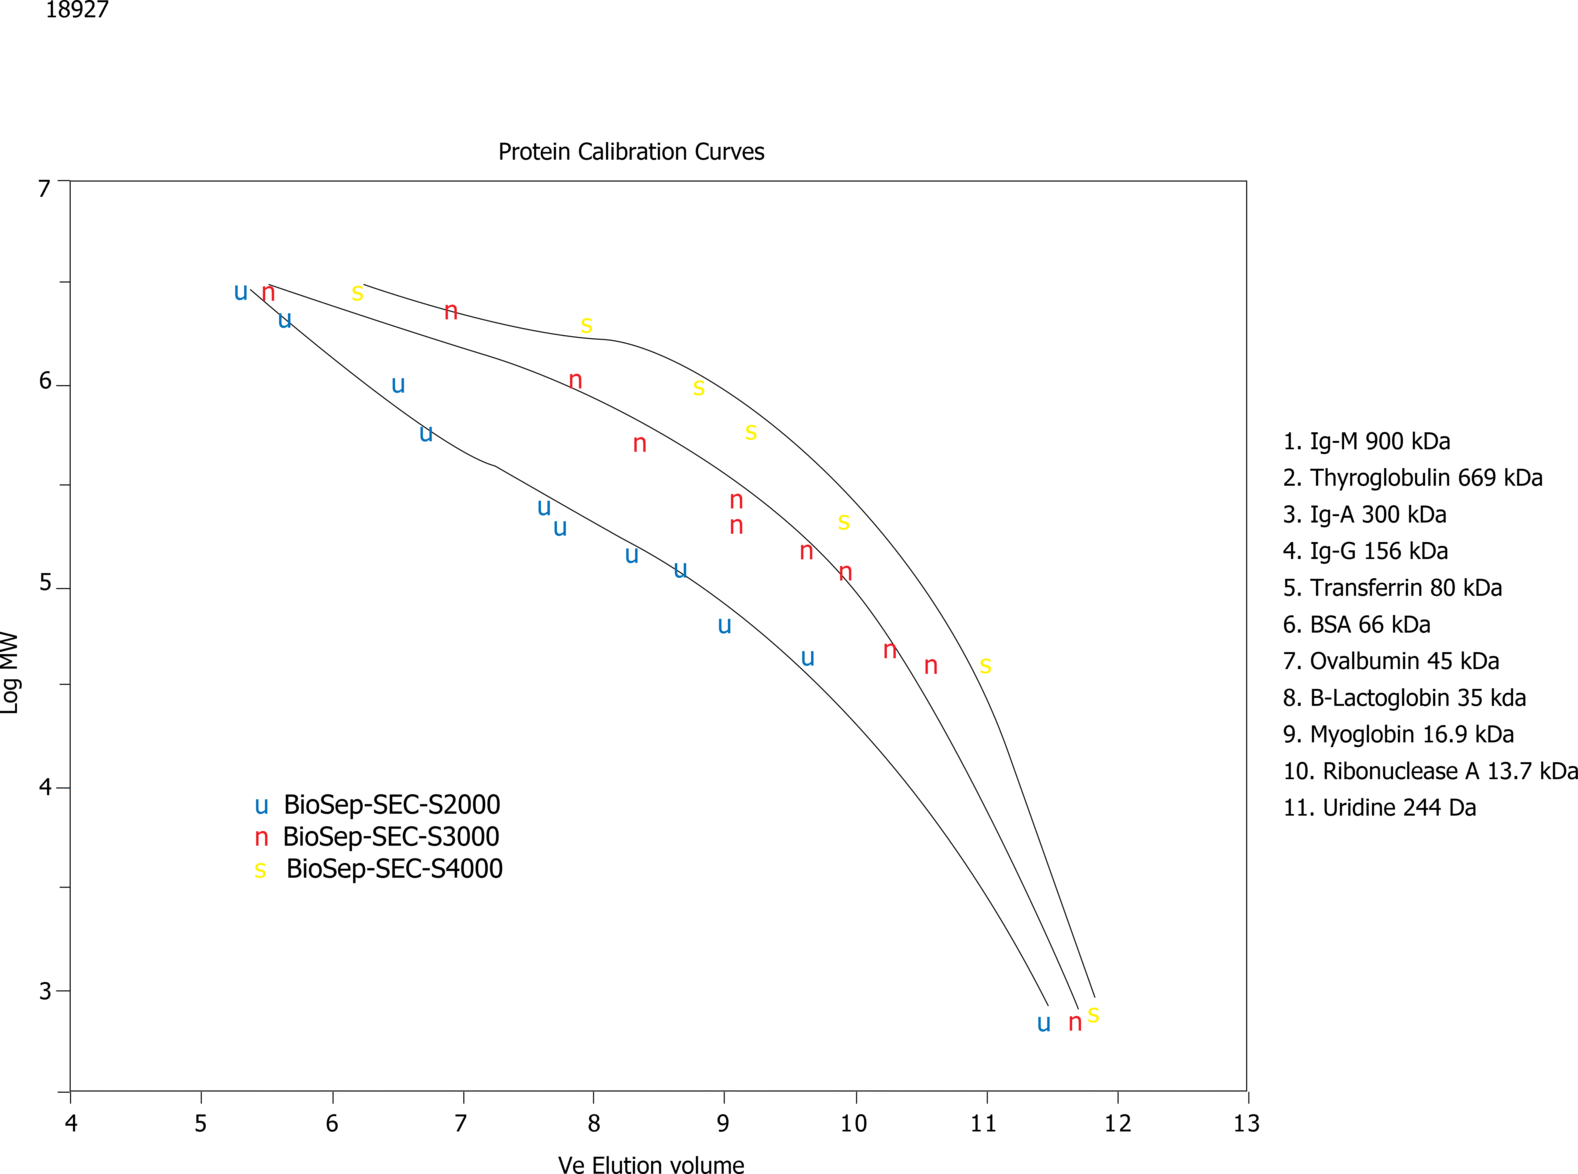
Protein Calibration Curves on BioSep-SEC-S (2)
18927
Separation Mode: Gel Filtration Chromatography (GFC)
Gel Filtration Chromatography (GFC)
SEC-s3000
HPLC
Pharmaceutical/Biopharmaceutical
Life Science
Protein
Biochemical Compound / Nutrient
Analytes
Details
LC Conditions (App ID: 18927)
Column: |
Brand Name: BioSep-SEC-S |
Part No: |
Phase Name: SEC-s3000 |
Sample Note: Application Focus: To show the calibration curves for the three different BioSep-SEC phases
For this application, calibration curves are generated for the three different BioSep-SEC phases using standard proteins of defined molecular weights and non-denaturing operating conditions (100 mM phosphate, 300 mM NaCl, pH 7.0, 1mL/min). For each media (300 x 7.8 mm column) the elution volume where each protein peak elutes was plotted against the log of the expected molecular weight of each protein. A 3rd order polynomial is used to plot the calibration curve for each phase.
Specific applications used to generate curves were: App ID# 18892 for BioSep2000, App ID# 18928 for BioSep3000 and App ID#18936 for BioSep4000. While a polynomial was used to generate calibration curves in this example, one could use a linear plot if one removes the data points at the ends of the molecular weight ranges. |
Similar Applications
No Data


