Clarity OTX

15 Minute Clean Up from Biological Samples
Isolate RNA and DNA-based therapeutics / metabolites from biological fluids and tissues in less time with Clarity OTX solid phase extraction (SPE) and buffer products.
- No liquid-liquid extraction (LLE) required require
- >80 % typical extraction recoveries
- Optimized for LC-MS bioanalysis
U.S. Patent No. 7,119,145
Order
General Extraction
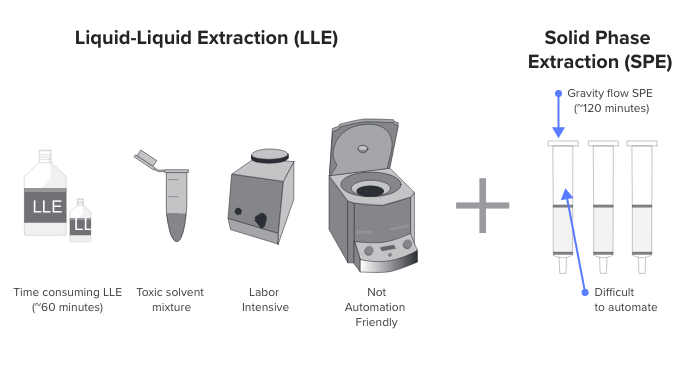
Common Extraction Procedure (~180 minutes)
Suitable for Most Oligo Therapeutics & Samples
encapsulated
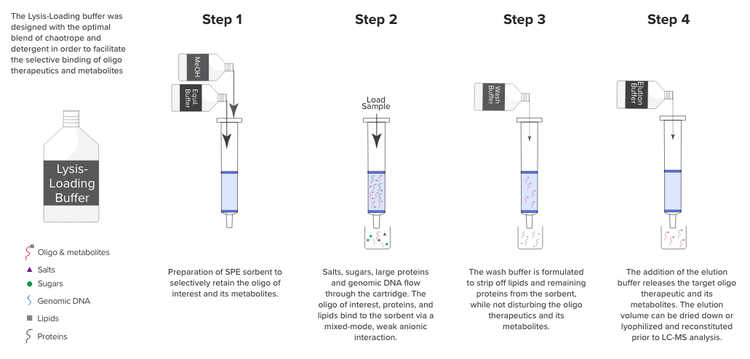
Extraction Protocol
Detect Low Dosage Levels
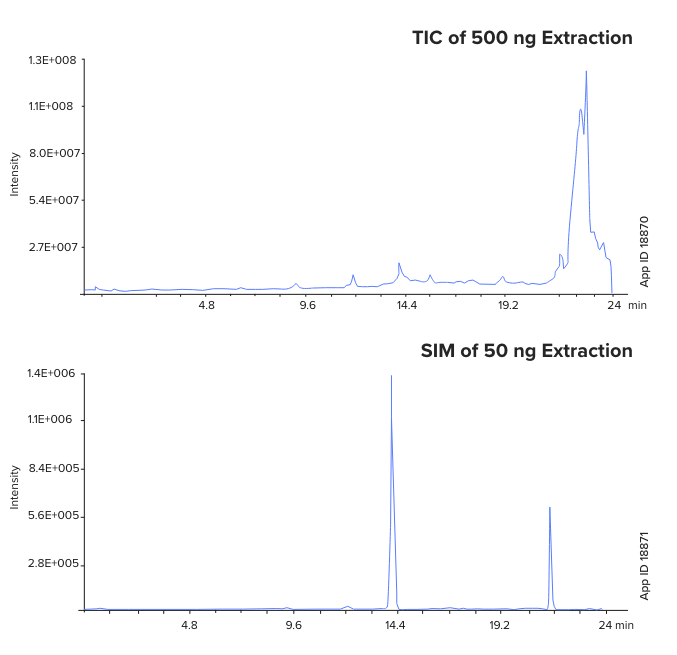
Due to the typical 80 % and greater recoveries of the parent oligonucleotide therapeutic and its metabolites, detection in the picomole range is possible. The TIC below illustrates detection of a dosage in this very sensitive range. Aliquots of 500 ng & 50 ng spiked into plasma were extracted using Clarity OTX to determine sensitivity limits. A TIC of the 500 ng load is shown below. The 14.3 minute peak corresponding to the 19mer P-S can be quantitated. While a peak is not observed for the TIC of the 50 ng load, using a XIC at m/z of 944 (the -7 charge state) one can still quantitate the oligonucleotide at very low levels.
Sensitivity Study in Plasma
A: 50 mM TEAA, pH 7.5 / 5 % Acetonitrile
B: Methanol
Sample:
25nt DNA oligonucleotide
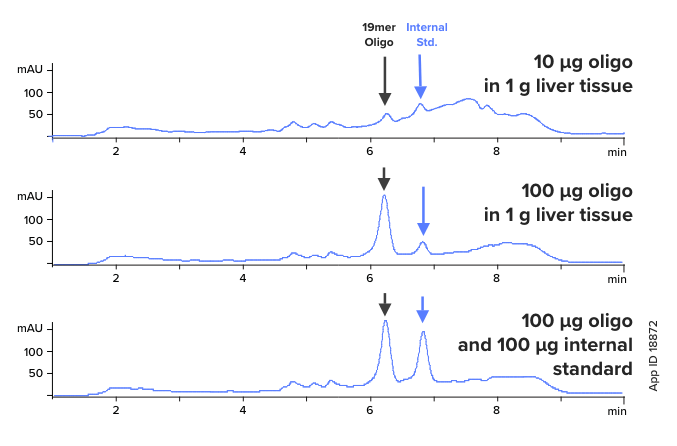
UV chromatograms of oligonucleotide extracted from liver tissue using Clarity OTX. The 19mer extracted phosphorothioate oligonucleotide was spiked with 10 µg of a oligonucleotide internal standard before analysis. The top two chromatograms represent different levels of the incubated P-S oligo. The bottom chromatogram is an external standard of equal amounts of the 19mer oligo and internal standard. Note the high recovery of the oligonucleotide and low level of plasma contaminants from the incubated samples.
Sensitivity Study in Live Tissue