
ADC DAR Analysis by Native RPLC-MS: A Padcev Method Development Case Study
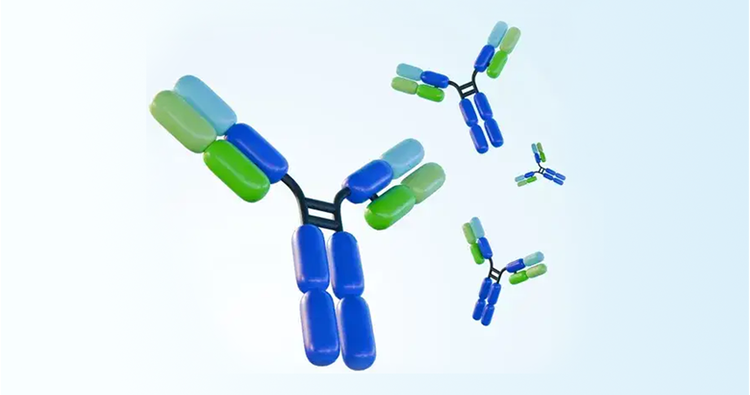
Antibody-drug conjugates (ADCs) are inherently heterogeneous. A single sample may contain multiple drug-to-antibody ratio (DAR) species, conjugation-site variants, glycoforms, and other proteoforms. This complexity can make it difficult to characterize the full DAR distribution with confidence.
Hydrophobic interaction chromatography (HIC) is widely used for DAR analysis. However, conventional HIC mobile phases generally contain high concentrations of non-volatile salts, which limit direct coupling with mass spectrometry. Native reversed-phase liquid chromatography coupled with high-resolution mass spectrometry (native RPLC-HRMS) provides an alternative. It combines chromatographic separation with direct mass analysis, all under near native conditions to limit structural disruption.
Native RPLC presents a unique method development challenge: limited organic modifier is required to preserve native structure and LC-MS performance, forcing a balance between retaining low-DAR species and recovering more hydrophobic, high-DAR species.
This blog summarizes a practical screening strategy using Padcev® as an example. Full gradients, instrument settings, and experimental details are available in the Technical Note, Screening Biozen Native RP-1 and RP-5 Columns for ADC Drug-to-Antibody Ratio (DAR) Determination.
What Does a Reliable DAR Method Need to Show?
It is useful to distinguish four related analytical objectives:
- Recovery: Were all relevant DAR populations detected?
- Resolution: Were the recovered species adequately separated?
- Identification: Did the intact mass support the assigned DAR states?
- Quantitation: What relative abundance did each DAR population contribute?
These objectives are closely connected, but they describe different aspects of method performance. Two species may both be recovered but remain partially unresolved. Similarly, a well-separated chromatographic peak cannot be assigned confidently from retention time alone. High-resolution MS provides the mass information needed to support the DAR assignment.
When multiple chromatographic components were observed within the same nominal DAR state, their peak areas were combined before the average DAR was calculated.
Understanding the DAR Ladder
DAR describes the number of linker-payload units attached to an antibody. Interchain cysteine-conjugated ADCs commonly contain prominent DAR 0, DAR 2, DAR 4, DAR 6, and DAR 8 populations. Together, these populations form a DAR ladder.
A nominal DAR population may also contain different conjugation-site variants, glycoforms, and other proteoforms. Depending on the selectivity of the method, some of these variants may appear as separate chromatographic peaks, while others may overlap or coelute.
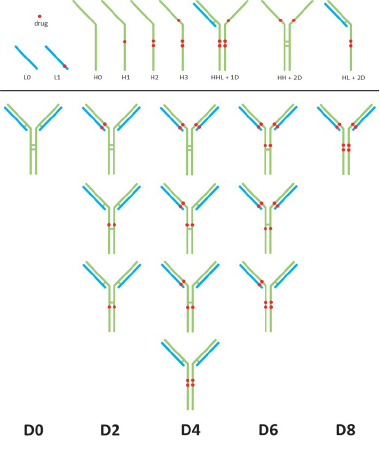
Figure 1. Schematic representation of ADC heterogeneity across different drug-load populations. Red dots represent conjugated linker-payload units.
Padcev is a practical, interchain cysteine-conjugated, MMAE-containing ADC that presents the method development challenges for both ends of the DAR ladder: sufficient retention of DAR 0 and elution of DAR 6 and DAR 8 with enough elution strength for effective recovery without compromising near native conditions
Screening the Padcev DAR Distribution
Biozen Native RP 1 and 5 columns provide a column screening platform for RPLC-MS DAR analysis, allowing analysts to adjust retention and selectivity across different ADC hydrophobicity profiles without the need to perform buffer exchanges or additional sample preparation.
Three combinations of stationary phases and LC conditions were evaluated:
- Native RP-5 with 50 mM ammonium acetate at pH 6.8 (Method 1)
- Native RP-5 with 50 mM Ammonium formate at pH of 4.5 (Method 2)
- Native RP-1 with 50 mM ammonium acetate at pH 6.8 (Method 3)
Below, the focus is on how Padcev’s DAR distribution is impacted based on each chromatographic method combination. The complete method conditions are provided in the Technical Note.
First Screen: Native RP-5 at pH 6.8
The initial screen used Native RP-5 with 50 mM ammonium acetate at pH 6.8. Under these conditions, DAR 2 through DAR 8 were retained and characterized, while DAR 0 was not retained.
The recovered species produced a weighted average DAR of 3.7, which was close to the reported Padcev average DAR of approximately 3.8. However, because the unretained DAR 0 population was not included, the calculation did not represent the complete chromatographic distribution.
This leads to the first screening question:
How to retain DAR0?
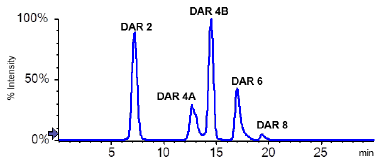
Figure 2. Extracted ion chromatogram of Padcev obtained using Native RP-5 with 50 mM ammonium acetate at pH 6.8. DAR 0 not retained.
Second Screen: Lowering the pH
To improve DAR 0 retention, the Mobile Phase A was changed to 50 mM ammonium formate at pH 4.5, and Biozen Native RP-5 was still used (Method 2).
Under Method 2 conditions, DAR 0 retention improved and resolution between DAR 6A and DAR 6B enhanced, but separation between DAR 4A and DAR 4B decreased.
This illustrates an important method development trade-off. A change that improves retention or resolution in one part of the DAR profile may reduce selectivity in another. The preferred condition therefore depends on whether the main objective is complete DAR recovery or greater separation of critical DAR variants.
DAR 4A and 4B are consistent with related isomeric variants but chromatographic retention and intact mass analysis alone cannot establish the exact conjugation sites. Definitive positional-isomer identification would require orthogonal analysis.
Nevertheless, under Method 2 conditions, the complete nominal DAR ladder from DAR 0 through DAR 8 was detected and the weighted average DAR was 3.6.
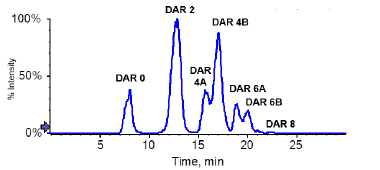
Figure 3. Extracted ion chromatogram of Padcev obtained using Native RP-5 with ammonium formate at an initial pH of 4.5.
Assessing Native-Like Charge-State Behavior
During electrospray ionization, an intact ADC acquires multiple charges and appears at several mass-to-charge, or m/z, values. Together, these signals form the charge-state distribution, or CSD. The charge-state signals can then be deconvoluted to determine the intact molecular mass.
Under comparable conditions, a relatively narrow CSD is generally consistent with a compact, native-like ion population. A broader distribution or a shift toward higher charge may indicate greater conformational extension. However, CSD is also influenced by mobile-phase composition, ionization, desolvation, source conditions, and instrument settings.
For Padcev DAR 2, the charge-state distributions obtained with the two Native RP-5 method conditions were similar. No substantial increase in unfolding was detected from this comparison. However, CSD remains an indirect indicator and does not prove that the complete solution-phase higher-order structure was preserved.
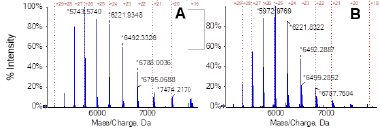
Figure 4. Spectrum of Padcev (m/z range 5000-8000) DAR2 obtained using a Biozen Native RP-5 column with 50 mM ammonium acetate (pH 6.8) as mobile phase A (Method 1) (A) and with 50 mM ammonium formate (pH 4.5) mobile phase A (Method 2) (B).
Third Screen: Native RP-1 at pH 6.8
Native RP-1 offered another way to retain DAR 0 without lowering the Mobile Phase A pH (Method 3).
Using Native RP-1 with 50 mM ammonium acetate at pH 6.8, the complete nominal Padcev DAR ladder was retained and characterized. The average weighted DAR was 3.5.
It is important to note that effective elution of DAR 8 required an IPA concentration above 30%. Because higher organic solvent exposure can affect protein conformation, the DAR 6 and DAR 8 charge-state distributions were compared with those obtained using the lower-pH Native RP-5 condition. The patterns were similar, suggesting that no substantial increase in unfolding was detectable under the evaluated conditions.
Native RP-1 therefore provided another route to complete nominal DAR recovery at an initial pH of 6.8, with the trade-off of using higher organic to elute highly loaded species.
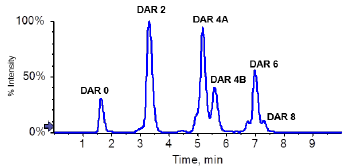
Figure 5. Padcev DAR distribution obtained using Native RP-1 at pH 6.8, with representative DAR 6 and DAR 8 charge-state spectra.
Comparing the Three Conditions
The three experiments show how changes in stationary-phase chemistry and mobile-phase conditions affect Padcev’s DAR profile.
The values are based on EIC peak areas over m/z 5000 to 8000. Differences among the calculated values may reflect recovery, integration, intensity thresholds, and MS response, as well as the underlying sample distribution.
A Screening Workflow for DAR Analysis
The method development screening workflow applied to Padcev is based on the Biozen Native RP column screening strategy described in the Technical Note, which provides additional guidance for selecting and optimizing conditions across different ADCs.
- Select the column phase: Select RP-5 or RP-1 based on the payload’s hydrophobicity.
- Check the retention of DAR 0: Confirm the retention of DAR 0 and other weakly retained DAR species.
- Check DAR distribution: Adjust the gradient if highly loaded populations do not elute or consider the other Biozen Native RP column and other suggested method conditions.
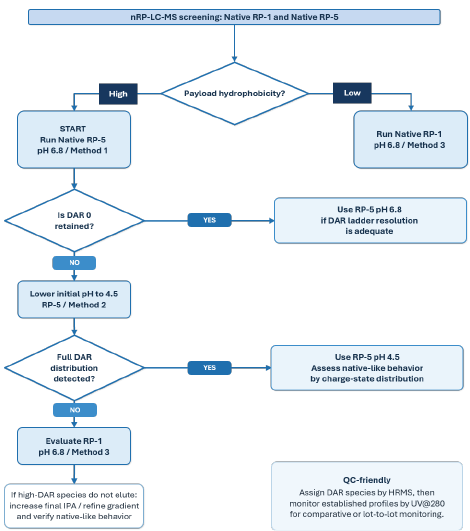
Figure 6. Screening workflow for selecting Native RP chemistry and optimizing intact ADC DAR analysis.
A Note on Interpretation
The Padcev results show how column chemistry and mobile phase conditions can be used to chromatographically separate an ADC’s DAR ladder. The data support nominal DAR assignments and comparisons of native-like charge-state behavior, but they do not independently prove preservation of higher-order structure, identify exact conjugation sites, or establish absolute molar abundance from EIC areas. To achieve that level of characterization, further orthogonal analyses are required.
Conclusion
There is no single native RPLC-MS condition that will provide the preferred balance of recovery and resolution for every ADC.
For Padcev, Native RP-5 at pH 6.8 resolved DAR 2 through DAR 8 but did not retain DAR 0. Changing the aqueous mobile phase to ammonium formate at pH 4.5 recovered the complete nominal DAR ladder but changed certain DAR selectivities. Native RP-1 at pH 6.8 also recovered the complete ladder but required higher organic content to elute DAR 8.
The practical approach is to screen with the methodology illustrated in the flowchart above.
Complete experimental conditions, Padcev results, and the screening decision tree are available in the Technical Note, Screening Biozen Native RP-1 and RP-5 Columns for ADC Drug-to-Antibody Ratio (DAR) Determination.
FAQs
What is DAR and how is average DAR calculated?
Drug-to-antibody ratio describes the number of linker-payload units attached to an antibody. Average DAR represents the weighted mean across the measured DAR distribution. In the Technical Note, average DAR was calculated from EIC peak areas, with chromatographic components summed up within each nominal DAR state before calculation.
How are DAR species identified by native RPLC-HRMS?
High-resolution MS measures the charge-state envelope of each intact ADC population. Deconvolution converts the multiply charged signals into an intact molecular mass, and the observed mass increments support assignment of the nominal DAR states. Both techniques can separate DAR species according to differences in hydrophobicity. Conventional HIC commonly uses high concentrations of nonvolatile salts that limit direct MS coupling and is unable to resolve potential DAR isomers. Native RPLC uses volatile buffers, allows the use of organic content (within reason), and resolves potential isomers of DAR species, supporting direct LC-MS analysis without needing buffer exchanges or additional sample preparation.
What is the difference between native RPLC and HIC?
Both techniques can separate DAR species according to differences in hydrophobicity. Conventional HIC commonly uses high concentrations of nonvolatile salts that limit direct MS coupling and is unable to resolve potential DAR isomers. Native RPLC uses volatile buffers, allows the use of organic content (within reason), and resolves potential isomers of DAR species, supporting direct LC-MS analysis without needing buffer exchanges or additional sample preparation.
Can UV be used for routine DAR monitoring?
With Native RPLC-MS, method conditions can be developed for simultaneous UV and MS analysis; thus, making native RPLC-MS friendly to routine monitoring lab environments.