Characterization of an antibody - oligonucleotide conjugate (AOC) using native mass spectrometry and peptide mapping

Authors: Jingwen Ding, Roxana Eggleston - Rangel, Sujatha Chilakala, Zoe Zhang and Haichuan Liu
Abstract
This technical note describes comprehensive characterization of an antibody- oligonucleotide conjugate (AOC) using native mass spectrometry (MS) and peptide mapping approaches on a single MS platform (Figure 1). Native MS provided rapid mass measurement of the intact AOC and its building blocks, leading to sequence confirmation and oligonucleotide- antibody ratio (OAR) determination. Peptide mapping with electron- activated dissociation (EAD) offered unique capabilities for accurate localization of labile modifications and conjugation sites, confident disulfide bond mapping and isomer differentiation.
AOCs are a new class of drug molecules that combine high precision and low toxicity of oligonucleotide therapeutics with high specificity and affinity of an antibody to the target antigen for improved drug delivery.1,2 Typically, AOCs are composed of an oligonucleotide, such as antisense oligonucleotide (ASO) and double- stranded small interfering RNA (siRNA) , conjugated to an antibody through a chemical linker. AOC characterization using LC -MS is challenging due to the need to confirm oligonucleotide and antibody sequences, measure the OAR, determine the conjugation sites , and assess the impurity level.
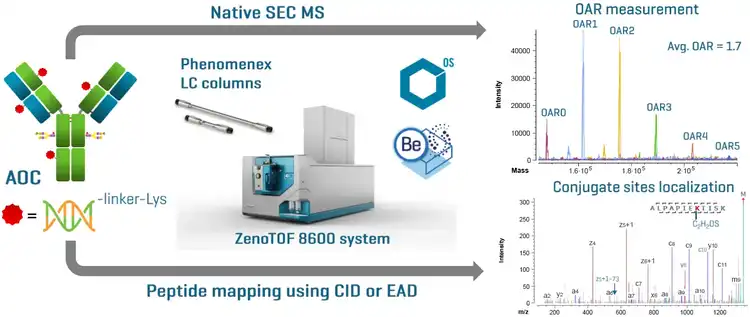
Figure 1. AOC analysis using complementary, streamlined LC - MS approaches AOC characterization is streamlined from chromatographic separation using Phenomenex columns, native size exclusion chromatography (SEC) MS , and peptide mapping analyses using the ZenoTOF 8600 system to data analysis using SCIEX OS software and Biologics Explorer software.
Key features of the ZenoTOF 8600 system for AOC characterization
- High sensitivity: The improved hardware of the ZenoTOF 8600 system provides MS sensitivity to expand the capabilities of native MS and peptide mapping 3,4
- Versatility: The ZenoTOF 8600 system —equipped with highly sensitive Zeno CID or EAD—delivers high - quality MS and MS/MS data in both positive and negative ion modes
- Capabilities of EAD: EAD offers unique capabilities for accurate localization of labile PTMs or conjugation sites, confident disulfide bond mapping and unambiguous isomer differentiation
- Streamlined: AOC characterization is streamlined by utilizing Phenomenex columns for chromatographic separation, ZenoTOF 8600 system for data acquisition, and SCIEX OS software and Biologics Explorer software for data processing
Methods
Sample preparation: A trastuzumab biosimilar (Tras) and TrassiRNA AOC were purchased from VectorBuilder. Intact samples were diluted in water and analyzed without further purification. 10 μg of samples were injected for native SEC MS analysis. The peptide mapping samples of Tras- siRNA were prepared by performing denaturation with 7.6 M guanidine hydrochloride in 50 mM Tris buffer. The denatured solution was treated with or without dithiothreitol (DTT) for the reduced or non- reduced peptide mapping experiment. The reduced and non - reduced samples were diluted prior to an overnight enzymatic digestionusing the trypsin/ lys- C mix (Promega). 0.5 μg-1 μg of the final solutions were analyzed in peptide mapping experiments.
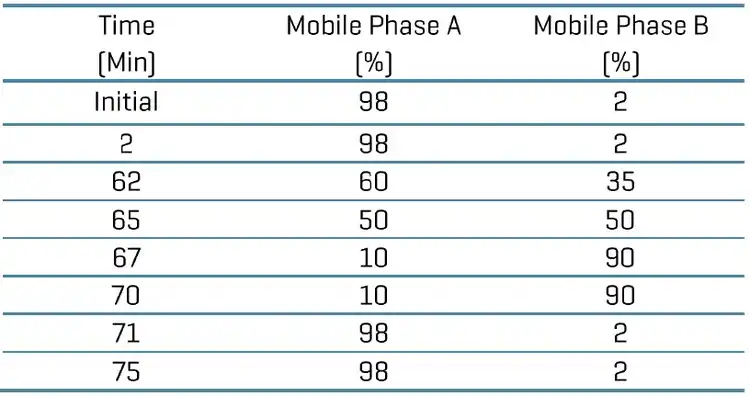
Chromatography: SEC separation was performed with a Phenomenex Biozen dSEC - 2 column (150 x 2.1 mm, 1.8 μm) using an isocratic gradient of 50 mM ammonium acetate at a flow rate of 0.2 mL/min . The total run time was 15 minutes. The peptide mapping samples were analyzed with a Phenomenex Biozen Peptide XB - C18 column (150 x 2.1 mm, 1.7 μm) using a 60- min linear gradient, as shown in Table 1. A flow rate of 0.25 mL/min was used for the chromatographic separation. The column was kept at 60 C in the column oven of an ExionLC AD system (SCIEX). Mobile phase A was 0.1% formic acid (FA) in water and mobile phase B was 0.1% FA in acetonitrile.
Table 1. Gradient for peptide separation .
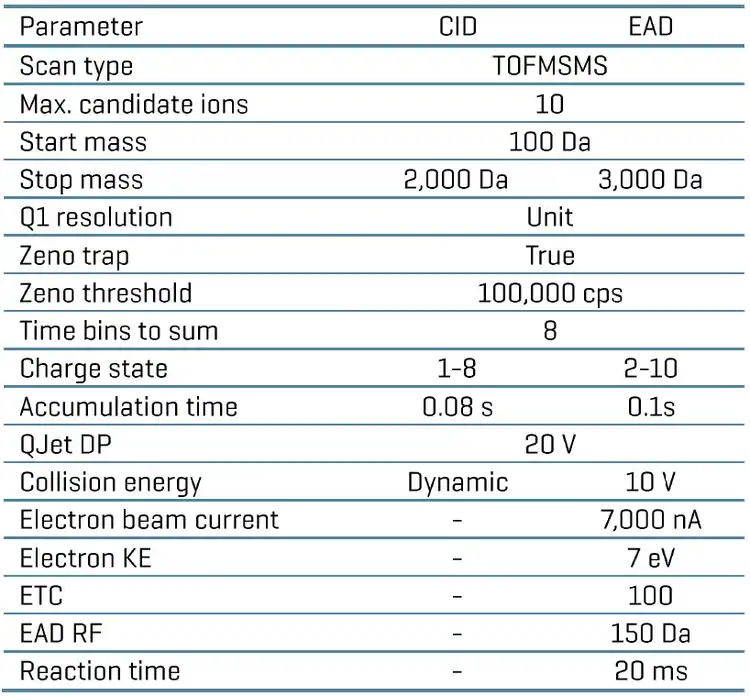
Mass spectrometry: MS data were acquired using the ZenoTOF 8600 system (SCIEX). A TOF MS method was employed to acquire the native SEC MS data in the positive or negative mode. The key source and TOF MS parameters are shown in Table 2. A data- dependent acquisition (DDA) method with CID or EAD was used to acquire the peptide mapping data. Key CID or EAD MS/MS parameters are shown in Table 3.
Table 2. Source and TOF MS parameters.
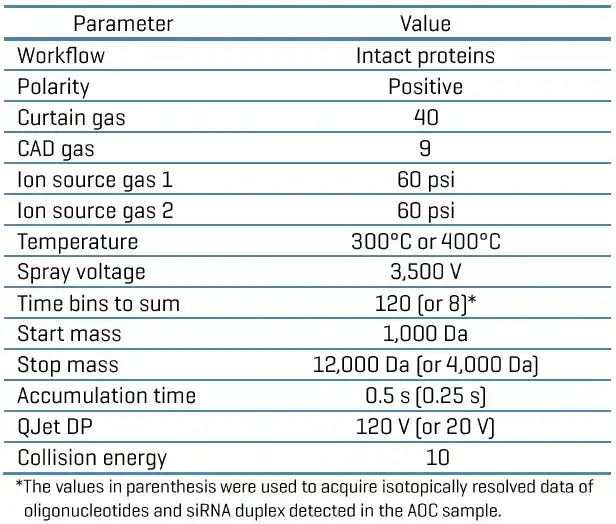
Table 3. CID and EAD MS/MS parameters.
Data analysis: Native SEC MS and peptide mapping data were analyzed using Biologics Explorer software (SCIEX). The Bio Tool Kit within SCIEX OS software was also employed for the analysis of oligonucleotides and siRNA duplex.
Lys - linked Tras - siRNA AOC
The AOC analyzed in this work was synthesized for the purpose of technological evaluation. This AOC consists of an siRNA duplex conjugated non- specifically to the Lys residues of Tras. Figure 2 illustrates the synthesis of this Tras- siRNA AOC. The Lys residues o n Tras were modified with a thio- containing group (C2H2OS, +74 Da). A maleimide linker was added to the 3’ end of the sense oligonucleotide (SO) o n the siRNA. The conjugation between the thio group and maleimide linker resulted in a mixture of Tras- siRNA species with different OARs. Despite the high heterogeneity of this AOC, native SEC MS and peptide mapping using CID or EAD provided high - quality data for its comprehensive characterization, as described below.
Native SEC MS analysis
The previous technical note demonstrated the benefits of >3x increase in MS sensitivity offered by the ZenoTOF 8600 system for enhanced native MS analysis of biotherapeutics containing non- covalent interactions, such as Cys - linked antibody- drug conjugates (ADCs) and aggregates. 3 The AOC analyzed in this work consists of a labile linkage between the maleimide linker and Tras, making it cha llenging to detect the intact form under the denaturing condition using traditional reverse phase LC -MS approaches (data not shown). By comparison, native MS was effective in preserving weak bonding or interactions for intact mass and OAR measurements.
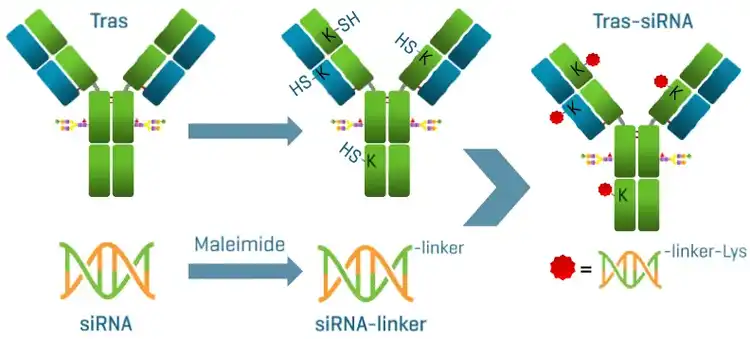
Figure 2. Schematic illustration of Tras - siRNA synthesis. The introduction of a thio- containing group to Tras and the non - specific siRNA - to- Tras conjugation led to sample heterogeneity as described below.
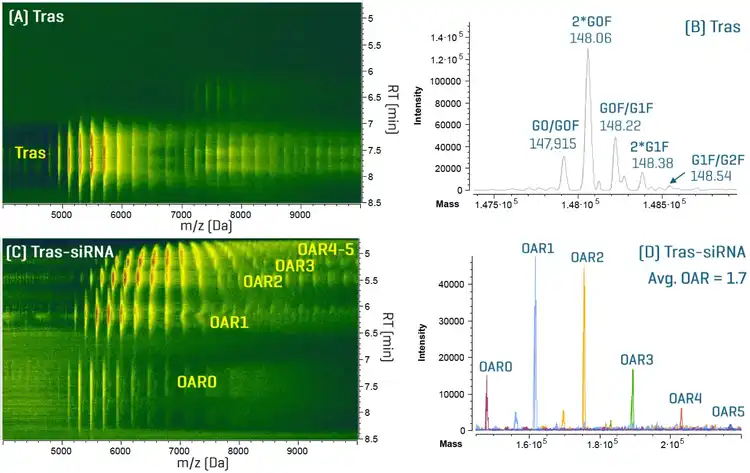
Figure 3. Native SEC MS analysis of Tras and Tras - siRNA. The ion map of Biologics Explorer software offers an excellent visualization of native SEC MS data of Tras (A) and Tras - siRNA (C). A distribution of OAR species was clearly detected in the ion map of Tras - siRNA (C). Spectrum d econvolution using Biologics Explorer software provided peak annotation for the major glycoforms of unconjugated Tras (B) and AOC species with different OARs in Tras- siRNA, leading to the determination of an averaged OAR of 1.7 for this AOC (D).
Figure 3 shows the ion maps and deconvolution results of Tras and Tras-siRNA from native SEC MS analysis. The ion map in Biologics Explorer software offers an excellent visualization of the changes introduced by siRNA conjugation. A broad distribution of Tras-siRNA species with OARs of up to 5 was noticeable in the AOC sample (Figure 3B) compared to the unconjugated Tras (Figure 3A). Spectrum deconvolution within Biologics Explorer software led to confident assignments of various glycoforms for Tras (Figure 3B) and OAR(0-5) species for Tras-siRNA (Figure 3D). From the relative abundance of these OAR species, an average OAR of 1.7 was obtained for the AOC (Figure 3D).
The AOC analyzed in this work was synthesized for technological evaluation and was not fully purified. In addition to different OAR species, the building blocks—ASO, SO and siRNA duplex—were detected in the AOC sample. These species were chromatographically separated using the Phenomenex Biozen dSEC-2 column and detected with native SEC MS in the positive or negative ion mode. Figure 4 shows the mass spectrum and deconvolution result of the ASO, SO and siRNA from native SEC MS analysis in the positive mode. The mass spectrum revealed the presence of unconjugated ASO and abundant linker-conjugated SO and siRNA species with H2O addition (Figure 4A). The hydrolysis of SO and siRNA was likely resulting from the ring-opening of the maleimide linker, as reported in literature.5 Spectrum deconvolution using the monoisotopic or average (not shown) masses confirmed the identity of these oligonucleotides with mass errors of <5 ppm (Figures 4B-4D). These AOC building blocks were also detected and confirmed by native SEC MS data acquired in the negative mode (data not shown). The detection and confident assignments of the building blocks increased the confidence in intact mass analysis of this complex and heterogeneous AOC. These results demonstrate the effectiveness of the enhanced native SEC MS workflow for intact mass analysis of an AOC and its components.
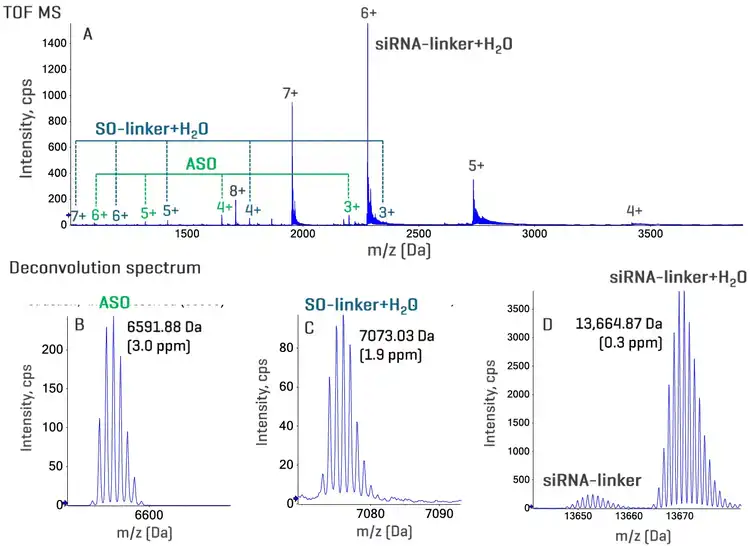
Figure 4. Detection and confirmation of Tras-siRNA building blocks. The ASO, SO, and siRNA duplex of Tras-siRNA were chromatographically separated from intact OAR species using the Phenomenex dSEC-2 column and detected in the isotopically resolved native MS spectrum (A). Spectrum devolution using the monoisotopic masses confirmed the unconjugated ASO (B) and linker-conjugated SO and siRNA duplex (C and D). The latter 2 species were present predominantly as the hydrated forms (+H2O), which can be produced from the ring-opening of the maleimide linker.
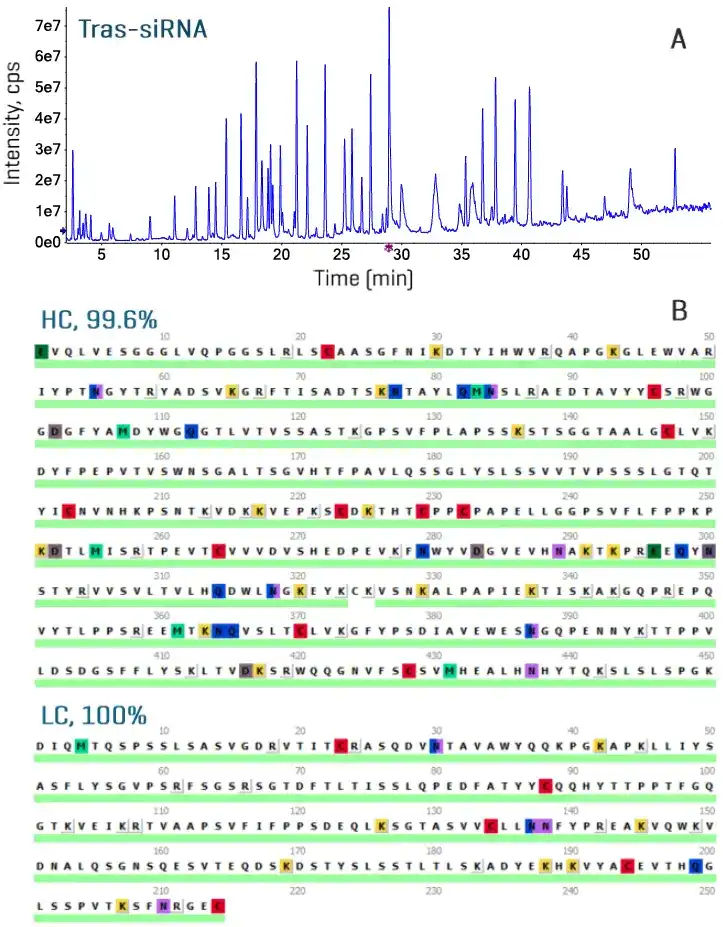
Figure 5. Total ion chromatogram (TIC) and sequence coverage map from the reduced peptide mapping experiment. The Phenomenex Biozen Peptide XB - C18 column provided excellent separation of Tras peptides (A), enabling a nearly complete sequence coverage of Tras HC and LC using EAD (B) or CID (not shown).
Peptide mapping
The hardware improvements of the ZenoTOF 8600 system compared to the previous system led to >3x increase in MS sensitivity for enhanced peptide mapping analysis. 4 In this work, the reduced and non- reduced peptide mapping workflows using CID or EAD were employed to achieve comprehensive AOC characterization involving sequence confirmation, conjugate sites localization, PTM analysis , disulfide bond mapping , and isomer differentiation. Figure 5 shows the TIC and sequence coverage of Tras - siRNA from the reduced peptide mapping analysis. The Phenomenex Biozen Peptide XB - C18 column provided excellent separation of Tras peptides to ensure comprehensive antibody characterization (Figure 5A). Peptide mapping using EAD (Figure 5B) or CID (not shown) provided a nearly complete sequence coverage of Tras for its high- confidence sequence confirmation . The siRNA conjugate sites on Tras were localized with the identification of Lys- containing peptides carrying the thio - containing group (C 2H2OS, +74 Da). In total, 26 different Lys residues on HC or LC of Tras were identified as the conjugate sites of siRNA using CID and EAD. Figure 6 shows CID and EAD spectra of 2 HC peptides confirming the conjugate sites on K320 and K337 of the HC. While both CID and EAD provided high-quality MS/MS spectra for confident identification of these 2 peptides, EAD led to more extensive backbone fragmentation and the generation of a diagnostic z-73 fragment for the thio-containing group (Figures 6B and 6D).
Compared to traditional collision-based MS/MS approaches such as CID, EAD offered unique capabilities of characterizing labile PTMs, disulfide linkages, and amino acid isomers. Figure 7 shows CID and EAD spectra of a glycopeptide and disulfide-linked peptide identified in the Tras-siRNA digest. For the G0F-containing glycopeptide shown in Figure 6A, CID preferentially cleaved the labile glycan, producing abundant oxonium ions at low m/z (e.g. 138 and 204) and few sequence fragments without the glycan. By comparison, EAD preserved the labile G0F in the c and z fragments for confident sequence identification and glycan localization (Figure 7B).
CID and EAD provide complementary information for comprehensive disulfide bond mapping. CID does not cleave the disulfide bond, limiting the extent of peptide backbone fragmentation (Figure 7C). As a contrast, EAD can cleave the disulfide bond, resulting in the formation of peptide-specific fragments (see 1Peptide and 2Peptide in Figure 7D) and more extensive backbone fragmentation for increased confidence in sequence identification.
EAD can generate diagnostic fragments for the unambiguous differentiation of amino acid isomers. Figure 8 shows the separation, detection, and EAD-aided differentiation of aspartic acid (Asp) vs. isoaspartic acid (isoAsp) isomers of a deamidated VVSV peptide. Three deamidation isomers were chromatographically separated using the Phenomenex Biozen Peptide XB-C18 column. The detection of a z3 - 57 fragment in the EAD spectrum allowed confident assignment of isoAsp for 2 isomers eluting at the earliest and latest retention times (Figures 8A and 8B). The presence of 2 isoAsp may be attributed to racemization of the L- to D-form. The assignment of the Asp isomer was confidently achieved based on the absence of the diagnostic z3 - 57 fragment and the detection of a z3 – 44 fragment (Figure 8C).
In summary, the enhanced native SEC MS and peptide mapping workflows offered by the ZenoTOF 8600 system provide comprehensive AOC characterization using a single MS platform.
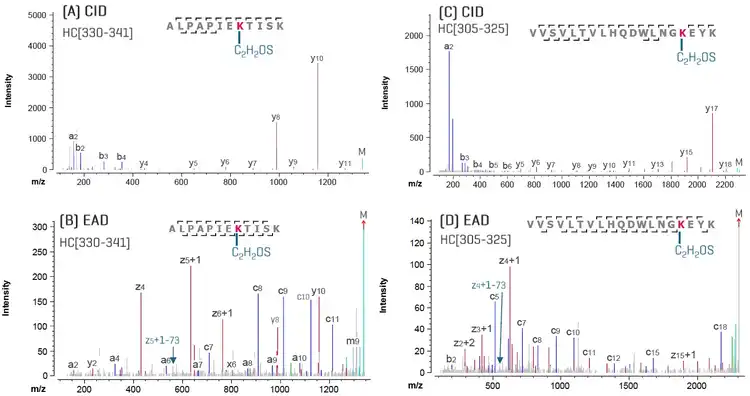
Figure 6. Conjugate sites localization. The identification Lys - containing peptides modified with the thio- containing group (C 2H2OS, +74 Da) enabled the determination of siRNA conjugation sites. Shown here are CID and EAD spectra of 2 out of 26 Lys - modified peptides identified using CID (A and C) or EAD (B and D).
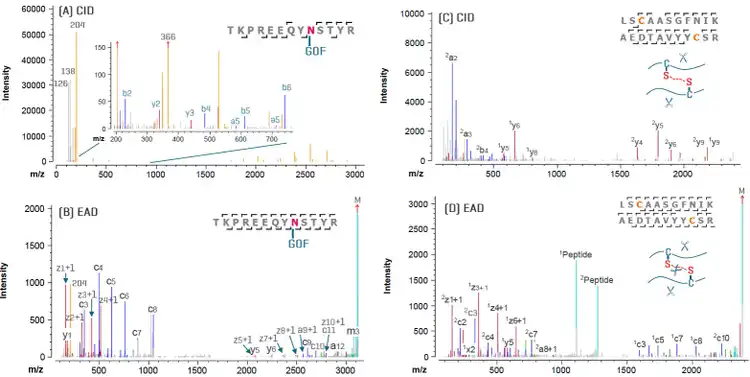
Figure 7. Glycosylation analysis and disulfide bond mapping. (A) CID led to preferential cleavage and fragmentation of the glycan G0F in this glycopeptide, producing abundant oxonium ions at low m/z (A). By comparison, EAD preserved the glycan in the c and z fragments, enabling precise localization of this labile PTM (B). CID and EAD provided complementary information for confident disulfide bond mapping (C and D). CID led to fragmentation of the peptide backbone without cleaving the disulfide linkage (C). However, EAD can cleave both peptide backbone and disulfide linkage (C), resulting in more extensive backbone fragmentation and the formation of diagnostic peptide peaks (see 1Peptide and 2Peptide in D).
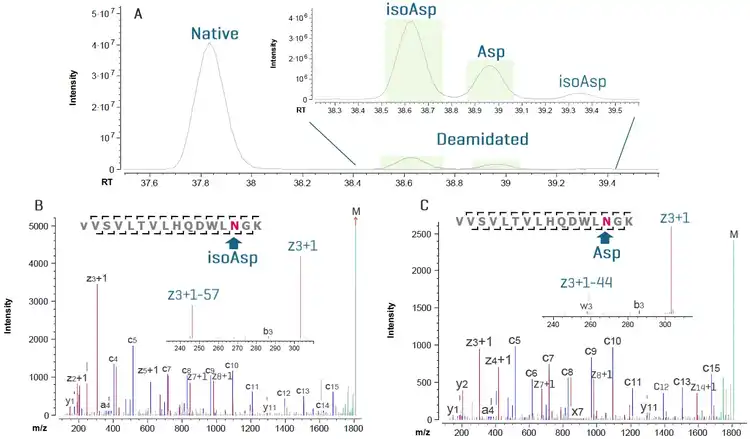
Figure 8. Isomer differentiation using EAD. EAD has the unique capability of generating diagnostic fragments for unambiguous differentiation of amino acid isomers, such as aspartic acid (Asp) vs. isoaspartic acid (isoAsp). The formation of a diagnostic z-57 fragment (inset in B) enabled the confident assignment for the isoAsp isomer.
Conclusion
- Comprehensive AOC characterization was achieved for Tras-siRNA using native SEC MS and peptide mapping with CID or EAD despite high sample heterogeneity
- Native MS analysis revealed the presence of AOC species with a distribution of OARs, leading to the determination of an averaged OAR of 1.7, and abundant H2O-adducted species from the ring-opening of the maleimide linker
- Peptide mapping using CID or EAD provided a nearly complete sequence coverage of Tras and conjugate sites localization based on the identification of thio-containing peptides
- Compared to CID, EAD provided additional benefits for labile PTM analysis, disulfide bond mapping, and amino acid isomer differentiation
- Phenomenex Biozen dSEC-2 and Peptide XB-C18 columns provide excellent separation of AOC species and Tras peptides, respectively, for acquisition of high-quality native SEC MS and peptide mapping data
FAQs
Why are complementary native MS and peptide-mapping workflows needed for AOC characterization?
AOC characterization requires information at multiple structural levels. Native SEC-MS measures the intact conjugate, determines the distribution of OAR species, and detects unconjugated or linker-modified oligonucleotide components. Peptide mapping provides antibody sequence confirmation and residue-level information on conjugation sites, post-translational modifications, and disulfide bonds. In this study, combining the two approaches enabled comprehensive characterization of a highly heterogeneous trastuzumab-siRNA conjugate using a single MS platform.
How was the oligonucleotide-to-antibody ratio determined?
The AOC was separated using a Biozen dSEC-2 column and analyzed by native SEC-MS. Ion-map visualization and spectrum deconvolution revealed intact conjugate species with OAR values from 0 to 5. The average OAR was calculated from the relative abundance of these species and determined to be 1.7. Native conditions were important because the maleimide-based linkage was labile and the intact conjugate was difficult to detect under the denaturing conditions used in traditional reversed-phase LC-MS.
Can native SEC-MS identify components and impurities in a heterogeneous AOC sample?
Yes. The evaluated AOC was produced for technological assessment and was not fully purified. Native SEC-MS detected the intact OAR distribution as well as the AOC building blocks, including unconjugated antisense oligonucleotide, linker-conjugated sense oligonucleotide, and linker-conjugated siRNA duplex. The oligonucleotide components were chromatographically separated from the intact conjugates, and deconvolution confirmed their identities with reported mass errors below 5 ppm. Hydrated linker-conjugated species associated with maleimide ring opening were also observed.
How were the siRNA conjugation sites localized on the antibody?
Reduced peptide mapping was performed using a Biozen Peptide XB-C18 column followed by CID or EAD analysis. Conjugation sites were identified by detecting lysine-containing peptides carrying the thio-containing modification used to link the antibody to siRNA. Across the antibody heavy and light chains, 26 lysine residues were identified as conjugation sites. Both fragmentation approaches generated suitable identification data, while EAD produced more extensive backbone fragmentation and a diagnostic fragment associated with the thio-containing group.
What additional structural information did EAD provide compared with CID?
EAD provided complementary structural information for labile modifications, disulfide linkages, and amino acid isomers. For a G0F glycopeptide, EAD preserved the glycan on sequence fragments, enabling localization, whereas CID preferentially fragmented the labile glycan. EAD could also cleave disulfide bonds and generate peptide-specific fragments that increased confidence in sequence assignment. For a deamidated peptide, diagnostic EAD fragments differentiated Asp from isoAsp isomers after chromatographic separation on the Biozen Peptide XB-C18 column.
References
- Li M et al. (2025) Advances in the pharmaceutical development of antibody- oligonucleotide conjugates. Eur. J. Pharm. Sci. 215: 107292.
- Jiao J et al. (2024) Overcoming limitations and advancing the therapeutic potential of antibody- oligonucleotide conjugates (AOCs): Current status and future perspectives. Pharm. Res. 209: 107469.
- Native mass spectrometry analysis of biotherapeutics and aggregates with enhanced sensitivity. SCIEX technical note, MKT-36146-A.
- A peptide mapping workflow with improved MS sensitivity for enhanced PQA characterization. SCIEX technical note, MKT - 35361-A.
- Wang L et al. (2024) Linker substitution influences succinimide ring hydrolysis equilibrium impacting the stability of attachment to antibody –drug conjugates . RSC Med. Chem. , 15: 612- 622.
Release Date: 10/2026 Reviewed Date: 10/2026