Understanding Chromatograms: A Beginner’s Guide to Analytical Chemistry
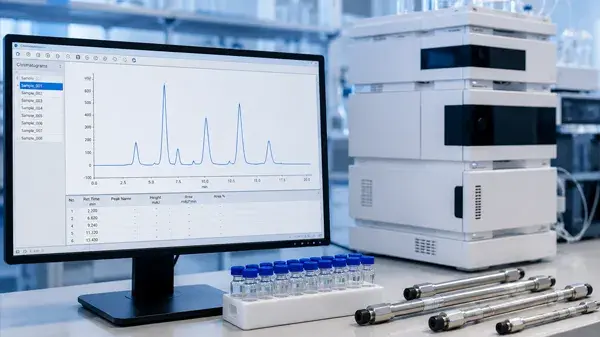
A chromatogram is a vital tool in analytical chemistry. This visual output shows the results of a separation process. Researchers rely on it to identify chemical components within complex mixtures. The visual data provide the foundation for accurate laboratory analysis across multiple scientific disciplines. Learning the basics of these charts will help you achieve favorable analytical results. Laboratories across the globe depend on precise separation profiles to make informed decisions about product safety and quality control.
What Is a Chromatogram?
When they first enter a testing laboratory, many beginners ask, “What is a chromatogram?” To illustrate the chromatogram meaning, we describe it as the physical or electronic graph generated by a detector during a chromatographic separation.
You might also ask, “For what are chromatograms used during daily operations?" They act as fingerprints for chemical samples. The graph maps the separation of molecules as they pass through a chromatographic system. This output allows the identification of individual substances on the basis of their unique chemical behavior. The visual display translates complex chemical interactions into clear and readable data points.
Basic Components of a Chromatogram
You must understand several core elements to grasp how to read a chromatogram correctly. The X-axis represents retention time, which shows the exact moment a compound exits the system. The Y-axis tracks signal intensity or detector response. The baseline indicates the background signal level when no compounds elute from the column. Peaks emerge from this baseline as separated compounds passing through the detector.
Electronic noise sometimes appears as small fluctuations along the baseline. This noise must be minimized to guarantee accurate peak detection. A clean baseline helps you measure even small peaks accurately. You must also account for dead time during your analysis. Dead time represents the time required for an unretained component to travel through the column. This metric helps method developers calculate other key performance factors.
Sometimes analysts encounter baseline drift during a run. Drift occurs when the baseline slowly rises or falls over time. Temperature changes or mobile-phase variations often cause this issue. You must correct baseline drift to maintain reliable peak measurements.
What Does a Chromatogram Show?
With respect to sample quality, analysts often ask, “What does a chromatogram show?” The data reveal compound identity through specific retention times. The peak area or peak height determines the quantity of each substance present. You can assess purity and resolution by examining peak shape and separation quality. Sharp and well-separated peaks indicate a highly refined method. Poor separation points to issues with the sample or the equipment.
This information helps with the evaluation of the overall success of an analytical run. Precise measurements ultimately dictate the reliability of the entire testing process. Specialized software is used to integrate peak areas automatically. This integration process converts the raw visual data into numerical values. You can then compare these values against a known calibration curve to determine exact concentrations.
Abnormal peak shapes often reveal underlying problems. A split peak might suggest column damage or sample contamination. Broad peaks indicate a slow mass-transfer process inside the column. You must monitor these visual clues to keep your instruments running perfectly.
Common Chromatographic Techniques
Different separation methods can be chosen based on specific sample requirements. The table below outlines three primary chromatographic techniques.
Gas chromatography (GC) requires volatile samples and uses inert carrier gases such as helium and nitrogen. A GC system directly analyzes gaseous samples, and its high temperatures turn liquid samples into vapor for analysis.
Liquid chromatography (LC) handles non-volatile or thermally unstable samples. You can explore options for liquid chromatography to see various column choices. High-performance liquid chromatography (HPLC) stands as the standard laboratory method for these analyses. Reversed-phase LC represents the most popular separation mode in modern labs. Thin-layer chromatography (TLC) relies on silica and alumina plates. The liquid mobile phase travels up the plate through capillary action. Analysts must select the appropriate solvent strength for the mobile phase to achieve ideal Rf values, which show how far a compound moves compared with the solvent front, during TLC.
Method developers often face specific troubleshooting problems, such as band broadening or tailing. You must refine the mobile-phase composition to fix these common issues. Choosing the right technique directly influences the accuracy of your final results.
Key Chromatographic Quality Parameters
Evaluating separation success requires you to measure specific mathematical parameters. These metrics help you improve your analytical methods and achieve consistent data.
Retention factor (k)
The retention factor indicates how long a compound is retained on the column relative to an unretained substance. A higher value means the analyte interacts strongly with the stationary phase. A very low value suggests the compound passes through the column too quickly for proper separation.
Selectivity (α)
Selectivity measures the separation between two peak tops. This parameter compares the retention factors of two different peaks to determine if the method distinguishes them properly. Good selectivity produces clear spacing between adjacent signals. You can improve selectivity by changing your mobile-phase composition or selecting a different column chemistry.
Efficiency (N)
This parameter defines the sharpness of a peak. Scientists often refer to efficiency as the number of theoretical plates. Narrow peaks mean the column packs high performance. High-performing columns allow you to separate complex mixtures containing many components. Longer columns and smaller particle sizes generally produce higher efficiencies.
Resolution (Rs)
Resolution calculates the baseline separation between two peaks. Method developers want a high resolution value to guarantee that peaks do not overlap. Complete baseline separation requires a resolution value greater than 1.5. You can find reliable HPLC supplies to help achieve better baseline resolution.
Peak asymmetry (tailing factor)
Peak asymmetry evaluates the peak shape. A perfectly symmetrical peak has an asymmetry value of 1. Tailing occurs when the back half of the peak is wider than the front half. Fronting happens when the leading edge of the peak slopes gently while the back edge drops sharply. Analysts must correct severe asymmetry to maintain reliable quantitative data.
Practical Applications of Chromatograms
Chromatograms play a crucial role in many important real-world applications. Pharmaceutical labs rely on chromatogram data to verify active pharmaceutical ingredient purity. Quality-control teams use these charts to detect harmful impurities before products reach patients.
Environmental testing facilities analyze soil and water samples to measure pesticide residues or industrial pollutants. They rely on high-resolution methods to track emerging contaminants such as forever chemicals. Food-analysis laboratories test products for nutritional content and potential contaminants. They measure vitamin levels and identify toxic mycotoxins in agricultural crops.
Academic research labs depend on clear separation data to discover new molecules and publish valid scientific findings. Clinical laboratories measure biomarker levels in blood and urine samples to help diagnose diseases. These diverse applications demonstrate the universal importance of high-quality separation science. Accurate analysis protects public health and advances scientific knowledge globally.
FAQs About Chromatograms
What are chromatograms used for?
Chromatograms are used to identify and quantify chemical components within a mixture. The visual graphs allow researchers to measure the purity of a substance accurately. They also help analysts detect trace levels of contaminants in various consumer products.
Why does my chromatogram look different each run?
Chromatograms may look different for each run because variations occur owing to changes in system temperature, mobile phase composition, and column degradation. Small leaks in the plumbing can also shift retention times. You must verify that all instrument parameters remain constant to achieve reproducible results.
What is a chromatogram in HPLC?
An HPLC output displays the detector signal over time as a liquid solvent pushes compounds through a high-pressure column. The resulting graph shows peaks representing individual molecules. The area under these peaks correlates directly to the analyte concentration.
How to interpret and analyze chromatogram data for accurate results?
You should first verify that the baseline is stable and flat. Next, check the retention times to identify the chemical compounds. Finally, integrate the peak areas to calculate exact quantities based on your established calibration curve.
What are the results of a chromatogram?
The final results of a chromatogram include qualitative data, such as retention times, and quantitative data, like peak areas. Analysts compile this information to generate a comprehensive final report. This report confirms the exact chemical composition of the tested sample.
How do I interpret a chromatogram report?
Chromatogram reports are read by comparing the sample peaks against known standards. The document will list retention times, peak areas, and calculated concentrations. You evaluate these numbers to determine if the sample meets your strict quality specifications.