LC-MS: Definition, Working, and Analysis
When analytes sit at trace levels, co-elute in complex matrices, or require stronger identity confirmation than retention time alone can provide, laboratories often turn to liquid chromatography-mass spectrometry (LC-MS). LC-MS combines chromatographic separation with mass-based detection, which gives researchers a practical way to separate, identify, and quantify compounds in pharmaceutical, biotech, environmental, food, and academic workflows.
The following article explains what LC-MS is, how it works, which instrument components drive performance, and how teams can approach LC-MS data analysis with more confidence.
What is LC-MS?
LC-MS is an analytical technique that helps resolve, identify, and measure compounds in complex samples. The LC stage separates components over time, while the MS stage converts eluting compounds into ions and measures them according to mass-to-charge ratio (1, 4). That combination makes the LC-MS technique especially useful for non-volatile, polar, and thermally labile analytes, since soft ionization approaches such as electrospray ionization (ESI) are commonly used for LC-MS of thermally labile and high molecular weight compounds.
The real value of LC-MS comes from the way chromatographic separation and mass-based confirmation work in tandem. That is why LC-MS now plays a central role in impurity profiling, metabolite studies, residue screening, contaminant analysis, and biomarker research.
How Does an LC-MS System Work?
Anyone asking how LC-MS works usually needs a clear sequence rather than a list of hardware names. The workflow begins with liquid separation, continues through ionization and mass analysis, and ends with digital data that support identification and quantification.
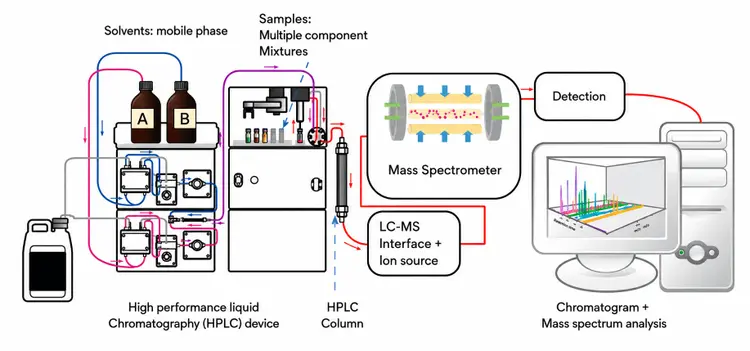
Figure 1. Simplified functional diagram of an LC-MS system, showing the liquid chromatography, ionization, and mass analysis stages that make up the workflow described below. Sourced from Wikimedia Commons (public domain, CC0).
Step 1: Liquid Chromatography Separation
The process begins when a prepared sample enters the LC system through the injector, and pumps deliver mobile phase through the analytical column at a controlled flow rate. The LC system includes the solvent delivery unit, injector, and analytical column, and its job is to control retention, selectivity, and sample loading before ions ever reach the mass spectrometer.
Each analyte interacts differently with the stationary and mobile phases, so compounds leave the column at different retention times instead of reaching the detector as one unresolved band. Good separation still matters in LC-MS because cleaner peaks often support cleaner spectra, stronger integration, and more reliable downstream interpretation during LC-MS data analysis. Many labs begin this refinement by evaluating LC columns matched to analyte polarity, matrix burden, and target throughput.
Step 2: Ionization Process
After compounds leave the LC column, the ion source converts them from the liquid phase into gas-phase ions that the mass spectrometer can analyze. The ion source is often where LC-MS performance is won or lost, since unstable ion formation, matrix suppression, and chemical background can all reduce sensitivity and quantitative reliability.
ESI is widely used for polar and larger molecules, while atmospheric pressure chemical ionization (APCI) often fits less polar and lower molecular weight compounds. Source selection also influences which analytes respond well, how much cleanup a method needs, and how reproducible the signal remains over long sequences.
Step 3: Mass Spectrometry Detection
The resulting ions then enter the mass analyzer, which separates them according to the mass-to-charge ratio. Common analyzer families include single quadrupole, (triple) quadrupole (TQ or QqQ), linear ion trap (LIT), and time-of-flight (TOF) systems, and each balances speed, sensitivity, resolution, and mass accuracy in a different way. Quadrupoles dominate many targeted quantitative assays, while time-of-flight and hybrid designs can support broader screening or exact-mass confirmation work.
Step 4: Data Acquisition
The detector and software convert ion intensity into chromatograms and spectra that analysts can review for screening, confirmation, and reporting. The detector records ion intensity, and the data system transforms that signal into peaks, spectra, calibration curves, and reportable results; the quality of this digital output directly affects identification, integration, and reporting.
Full-scan acquisition supports broader untargeted review, while targeted acquisition sharpens focus on known analytes that need stronger selectivity. This four-step sequence is the practical answer to the working of the LC-MS instrument: separate the sample, generate ions, measure mass, and interpret the output in software.
LC-MS Techniques and Methods
Although “technique” and “method” are used interchangeably, they answer different questions in practice. The phrase “LC-MS techniques” may refer to the analytical approach or instrument mode chosen for a particular goal, while “LC-MS method” may cover the fully defined procedure used for a specific matrix, target list, and reporting objective.
Common LC-MS Techniques
LC-MS techniques comprise the analytical approaches a lab chooses for a given problem. Reversed-phase (RP) LC-MS with ESI, for example, is a technique because it names the separation mode, coupling format, and ionization strategy without locking down exact conditions. Technique choice depends on analyte polarity, matrix complexity, whether the work is targeted or untargeted, and the level of structural certainty the project requires.
LC-MS Methods
An LC-MS method translates a chosen technique into a repeatable procedure. A validated gradient on a C18 column with defined source settings, selected transitions, calibration standards, and quality controls is a method because every critical variable is fixed and documented. That level of specificity matters because method performance depends on sample preparation, chromatographic conditions, source settings, calibration strategy, and QC elements working together.
Better Sample Preparation often reduces matrix effects early, and many teams add cleanup through SPE Products before the sample reaches the ion source.
LC-MS Data and Data Analysis
Useful answers do not come from raw output alone. Strong conclusions come from disciplined LC-MS data analysis that connect retention behavior, mass signals, calibration performance, and quality checks into one defensible interpretation.
Types of LC-MS Data
LC-MS produces chromatographic data and mass spectral data at the same time. A total ion chromatogram (TIC) shows the overall signal across the run, while an extracted ion chromatogram (XIC/EIC) tracks a selected mass signal for better analyte focus.
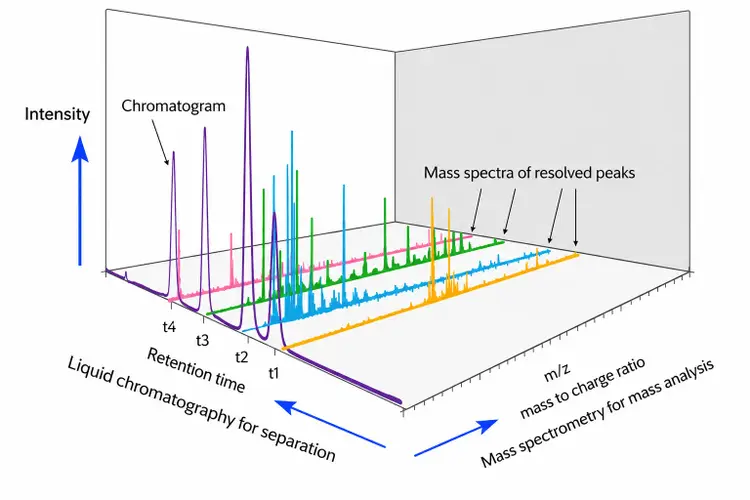
Figure 2. Three-dimensional LC-MS spectrum showing the relationship between retention time, mass-to-charge ratio, and signal intensity across a chromatographic run. Sourced from Wikimedia Commons (public domain, CC0).
Selected ion monitoring (SIM) narrows attention to chosen ions for sensitive targeted detection, full scan captures broader spectral information for screening, and tandem mass spectrometry (MS/MS) spectra add fragmentation patterns that support structural confirmation.
Targeted LC-MS/MS workflows can also use selected reaction monitoring (SRM), or multiple reaction monitoring (MRM), to monitor precursor-to-product ion pairs with high selectivity in a single LC-MS run.
LC-MS Data Analysis Workflow
Most workflows move through peak detection, integration, retention time review, mass confirmation, calibration assessment, and final result reporting. Analysts also review chromatographic shape, signal-to-noise behavior, mass agreement, and consistency with standards or reference materials before they release a result. Peak quality still matters in MS-based assays, and troubleshooting topics such as peak fronting can protect both integration quality and quantitative confidence.
Software and Tools
Most laboratories interpret LC-MS output through instrument control software, data processing platforms, and spectral or compound libraries. Those tools support peak review, library matching, calibration curves, audit trails, exception handling, and reporting for routine and regulated environments. Open-source tools also support targeted assay development and review, including OpenMS and TOPP for LC-MS data analysis, Skyline for SRM/MRM method building, and MRMPlus for quality control and assessment.
Applications of LC-MS
LC-MS serves a wide range of industries, which is why many laboratories now view LC-MS technology as a core analytical platform rather than viewing MS as a niche detector. Pharmaceutical teams use LC-MS for drug development, impurity analysis, metabolite profiling, and pharmacokinetic studies, and targeted MRM LC-MRM-MS/MS of plasma is a proven method for quantifying proteins present at low nanogram-per-milliliter levels.
Food-safety laboratories use LC-MS and LC-MS/MS for multi-residue screening, including large target panels such as workflows reported for 311 pesticide active substances in agricultural soils and 152 veterinary drug residues across food commodities.
Environmental programs use LC-MS to detect pesticides, persistent organic pollutants, and other trace contaminants in soil and water samples. Clinical and biomarker research also relies on LC-MS for therapeutic drug monitoring, newborn screening, and disease marker studies where specificity and trace sensitivity matter.
High-throughput LC-MS/MS workflows demonstrate the full scale of what targeted multi-residue analysis can achieve in practice. A single run can separate and analyze hundreds of compounds simultaneously, reducing analysis time while covering a broad chemical space. Phenomenex’s pesticide screening application shows exactly this capability, with 535 pesticide compounds separated and analyzed in one LC-MS/MS workflow using QuEChERS sample preparation, covering compound classes from organophosphates and carbamates to triazoles, pyrethroids, and strobilurins.
Advantages and Limitations of LC-MS
Choosing LC-MS means balancing powerful analytical capabilities against practical demands in cost, complexity, and day-to-day operation.
Best Practices for LC-MS Method Development
Once the method framework is defined, performance depends on a few practical choices that shape reproducibility, signal quality, and long-term system stability. Strong results usually start with appropriate sample cleanup, careful column selection, mobile phase refinement, and close attention to contamination control.
Teams often improve performance when they match cleanup to matrix burden, choose selectivity-first column chemistry, refine source-compatible solvent conditions, and check blanks early in development. Early review of peak shape, calibration behavior, and system suitability can also prevent small issues from becoming poor quantitation or failed validation later.
FAQs on LC-MS
What is LC-MS used for?
LC-MS is used when a laboratory needs to separate compounds, confirm identity through mass-based detection, and measure low-level targets in challenging samples. That makes it especially useful for regulated testing, trace analysis, and workflows where chromatography alone cannot provide enough specificity. Common examples include impurity testing, metabolite profiling, multi-residue screening, contaminant monitoring, and biomarker research.
What is the difference between LC-MS and HPLC?
HPLC separates compounds through liquid chromatography, while LC-MS adds mass-based detection that improves identity confirmation and selectivity beyond LC alone. In practice, that means LC-MS can distinguish compounds by mass-to-charge ratio rather than relying only on chromatographic behavior, which gives the method stronger confidence in complex samples.
What is LC-MS quantification?
LC-MS quantification is the process of measuring how much of a target compound is present by linking instrument response to calibration standards and quality controls. Analysts usually review peak area, calibration curve fit, QC agreement, and signal consistency before accepting a result. In targeted workflows, selected ion monitoring and SRM/MRM can improve confidence in the reported value by focusing the method on specific analyte signals.