What Is an Analyte in Chromatography?
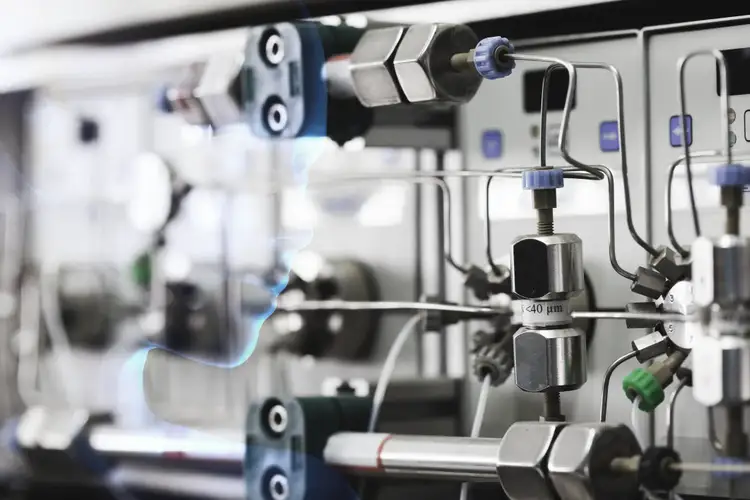
An analyte in chromatography is the specific chemical compound in a sample that you intend to separate, detect, and measure. It is distinct from solvents, reagents, and matrix components such as proteins, salts, and excipients.
In chromatography, the components of a sample mixture are separated through differential interactions with a mobile phase and a stationary phase, and the target analyte travels through the system and elutes as a measurable peak at a characteristic retention time (1).
Analyte Definition
In practical terms, the analyte is the preselected chemical species in your sample that drives your separation, identification, and quantification strategy in a chromatographic method. Analytical methods based on high-performance liquid chromatography (HPLC), gas chromatography (GC), and liquid chromatography-mass spectrometry (LC‑MS) rely on introducing a sample mixture into the mobile phase, which carries the target compound through a stationary phase where different interactions generate separation of individual components (1).
In any real matrix, such as plasma, soil extract, tablet powder, and food homogenate, the analyte coexists with many other components that are not of primary interest, which is why method development focuses on resolving the analyte in chromatography from that background (4).
How Does an Analyte Move Through a Chromatographic System?
Every chromatographic run follows the same basic journey. You dissolve the sample in a suitable solvent and introduce it into the flowing mobile phase, either through a manual injection, an autosampler, or an online extraction system. The mobile phase then carries the target compound into the column, where it meets the stationary phase and separates from other sample components based on differing interactions (1).
In column formats such as reversed-phase chromatography or gas chromatography, separation of solutes depends on their distribution between the stationary phase and the moving phase, and differences in this distribution are what produce different retention times for each analyte (2). Variables such as the diffusion coefficient of the analyte in the mobile and stationary phases, the linear velocity of the mobile phase, and the retention factor strongly influence separation efficiency and analyte retention. Therefore, they become critical levers when method developers adjust conditions to improve resolution or shorten analysis time (2, 3).
As the analyte moves through the column, it partitions repeatedly between the stationary phase and the mobile phase, which is why the compounds that interact more strongly with the stationary phase spend more time retained and elute later, while those that stay mostly in the mobile phase elute earlier. In practical HPLC work, this dynamic partitioning is captured in retention factors that you can tune by changing mobile phase composition, pH, temperature, and flow rate. In turn, analyte retention chromatography strategies always account for both analyte chemistry and operating conditions (2, 3).
In LC‑MS methods, the analyte then passes from the column into the ion source and mass spectrometer, where matrix components can still influence ionization. This means that the full journey from injection to detection must be considered when you design and interpret chromatographic analyses (4, 6).
Analyte vs. Matrix vs. Internal Standard: Key Differences
Chromatographic assays often involve three key concepts: analyte, matrix, and internal standard. The target compound analyte might be a drug, metabolite, pesticide, or impurity. The matrix is all other sample components besides the analyte of interest, including proteins, lipids, salts, excipients, and other endogenous compounds. These matrix components can modify the response of an analyte signal, especially in LC‑MS (4).
The internal standard is a known compound that you intentionally add to all samples, calibration standards, and quality control samples at a constant concentration to compensate for variability during sample preparation, extraction, injection, and instrument response in LC‑MS bioanalysis (5). By comparing the analyte signal to the internal standard signal, you can correct for losses or fluctuations and improve the accuracy and precision of quantification (5).
Analyte vs. Matrix vs. Internal Standard Table
Which Properties of an Analyte Affect Chromatographic Separation?
Every analyte has intrinsic physicochemical properties that directly influence how it behaves in a chromatographic system, and as a result, these properties dictate which mode you choose, how you formulate the mobile phase, and how you set temperature, flow, and gradient.
Practical method development guidance highlights that the selection of chromatographic mode and mobile phase composition is strongly influenced by traits such as pKa, lipophilicity, polarity, logP, molecular size, and charge state, and that small changes around the pKa can markedly change retention time and peak shape. As a result, developers adjust conditions to land retention factors in a useful range with symmetrical peaks (7).
Studies on UHPLC–MS methods for cannabinoids, for example, report that column chemistry and mobile phase composition are explicitly chosen based on analyte properties. These analytes are separated on reversed-phase chromatography columns with gradients of water and acetonitrile containing acidic modifiers like formic acid (6).
LogP and Lipophilicity
LogP, a measure of the analyte’s partition between octanol and water, reflects its lipophilicity and is a primary indicator of how strongly it will interact with a hydrophobic stationary phase in HPLC.
In practice, higher logP analytes tend to have longer retention in reversed‑phase systems, whereas low logP analytes may require ion‑pairing, HILIC, and alternative strategies to achieve adequate retention and separation (6, 7).
pKa and Ionization
For ionizable analytes, pKa is one of the most important variables because it controls the degree of ionization at any given mobile phase pH, and the charged and neutral forms interact differently with the stationary phase (7).
As a result, analyte-polarity considerations in HPLC always include selecting a mobile-phase pH that sets the analyte in a desired ionization state, often favoring the neutral form in reversed‑phase systems to increase retention and reduce tailing (6, 7).
Other Physicochemical Factors
Beyond logP and pKa, traits such as diffusion coefficients, molecular size, and hydrogen bonding capacity also shape separation outcomes. As noted earlier, mass transfer variables like diffusion coefficients and retention factor also come into play here, giving method developers another lever to fine-tune column selectivity (3).
Research on preparative RP‑HPLC/MS recovery shows that analyte physicochemical properties and impurities, together with column mass loading, significantly influence how well analytes can be collected after separation, underscoring that analyte properties shape both separation behavior and recovery (2, 10).
Types of Analytes in Chromatography
Real-world chromatography must handle many classes of analytes, and each class tends to pair with specific modes, detectors, and sample preparation workflows. It is widely used to separate and measure critical compounds in biological fluids and to analyze environmental samples for contaminants, and analyte types span small molecules, biomolecules, volatile organics, and inorganic ions (1, 6).
The type of analyte you target determines both how you prepare the sample and how you design the chromatographic run, including choices of sample preparation, stationary phase, and detector (1, 3).
Small-Molecule Analytes (Drugs, Metabolites, Environmental Contaminants)
Small-molecule analytes include pharmaceuticals, their metabolites, pesticides, residual solvents, and other low‑molecular-weight contaminants commonly measured in pharmaceutical, clinical, and environmental laboratories. Clinical uses of chromatography also include measuring small-molecule biomarkers associated with inborn errors of metabolism in patient samples (1). Chromatography is used in pharmacology to estimate the purity and potency of drugs, and to quantify them and their metabolites in body fluids, making small molecules one of the largest analyte classes in the field (1).
Methods such as reversed-phase chromatography with gradient elution and LC‑MS detection are often chosen to match the physicochemical properties of these analytes and deliver high sensitivity and specificity (6, 7).
Biomolecule Analytes (Proteins, Peptides, Nucleic Acids)
Biomolecule analytes such as proteins, peptides, and nucleic acids require different strategies because they are larger, often more labile, and can interact strongly with surfaces or matrix components.
These analytes may need dedicated sample preparation to remove proteins, salts, or lipids, and method developers frequently adopt modes such as ion‑exchange, size‑exclusion, or specialized reversed‑phase formats designed for peptide mapping or oligonucleotide analysis (1, 3).
Volatile Analytes (Residual Solvents, VOCs, and Flavors)
Volatile analytes include residual solvents in pharmaceuticals, volatile organic compounds (VOCs) in environmental monitoring, and flavor or fragrance components in food and consumer products. Gas chromatography is particularly suitable here, and research on gas–liquid separations shows that separation of volatile solutes depends on their distribution between a semi-gel stationary phase and a gaseous mobile phase, with variables such as diffusion coefficient and linear velocity influencing efficiency (2).
For these analytes, method development focuses on selecting stationary phases and temperature programs that provide sufficient resolution for structurally similar volatiles while keeping run times reasonable (2, 3).
Ionic Analytes (Inorganic Ions, Organic Acids, and Counterions)
Ionic analytes include inorganic ions such as chloride, sulfate, and nitrate, as well as organic acids, counterions, and charged excipients in pharmaceutical formulations. Chromatography is used to analyze these species in environmental water testing, pharmaceutical QC, and clinical laboratories, where the ionic form dictates both sample preparation and mode selection (1, 4).
Ion‑exchange chromatography and ion‑pair reversed‑phase methods are frequently used to handle such ionic analytes, with mobile phase pH and counterion selection chosen to manage the balance between retention, selectivity, and detection compatibility (3, 7).
How Is an Analyte Detected and Quantified in Chromatography?
Once the analyte has been separated from other components, it must be detected as it elutes from the column. Reliable detection and calibration strategies are essential for any analyte class, especially when chromatographic data support regulatory or clinical decisions (1).
In HPLC and UHPLC, analytes are commonly detected using UV-Vis absorbance, fluorescence, and MS, where the choice depends on analyte properties and sensitivity requirements. LC-MS methods often pair this detection with tandem mass spectrometry for added structural selectivity in analyte quantification (1, 6).
Quantification typically relies on constructing a calibration curve using standards that contain known concentrations of the analyte, run under the same chromatographic conditions. The relationship between peak area or peak height and concentration is modeled, and unknown samples are quantified by interpolating their response on this curve, which aligns with broader principles of calibration and recovery in chromatographic sciences (8).
In LC‑MS bioanalysis, internal standards are added at a constant concentration to all samples, calibrators, and QC samples to compensate for variability in extraction, injection volume, and instrument response, and their ratio to analyte signal is used for more accurate quantification (5).
Factors That Affect Analyte Recovery and Accuracy in Chromatography
For reliable results, the measured analyte signal must represent the true concentration in the original sample, yet many practical factors in analyte recovery chromatography workflows can distort this relationship. A technical overview of chromatographic sciences defines recovery as the fraction of the analyte amount present in the original sample that is ultimately measured by the analytical procedure, so any deviation from that fraction indicates loss or gain within the workflow (8).
Incomplete extraction, adsorption to surfaces, evaporation losses, and matrix effects can all lead to low or variable recovery and compromise the trueness of chromatographic results, so analysts need to identify and control these sources of error (8).
Factors that affect analyte recovery and accuracy include:
- Sample Preparation: Incomplete extraction, protein precipitation, and clean-up steps can leave an analyte trapped in the matrix, and HPLC-assay studies link evaporation during centrifuging and solvent volume displacement by the matrix to further losses (8, 9).
- Matrix Effects: Co-eluting components can suppress or enhance analyte ionization in LC-MS, altering response and creating bias if you do not correct with internal standards or matrix-matched calibration (4, 8).
- Instrument and Method Parameters: Research on preparative RP‑HPLC/MS indicates that the delay time between MS peak detection and fraction collection, detector signal‑to‑noise ratio, and chromatographic peak width have major impacts on purification recovery. Consequently, system setup and timing also influence accuracy (10).
- Analyte Properties: Physicochemical properties and the presence of impurities can change how easily analytes are extracted, separated, and collected, affecting both recovery and precision, which means method development must consider these attributes alongside matrix and instrument factors (2, 10).
FAQs on Analyte in Chromatography
Can a sample contain more than one analyte?
Yes. In many assays, the same chromatographic run measures several analytes in a single sample, especially when clinical or environmental methods quantify multiple drugs, metabolites, or pollutants in one procedure. The chromatographic system separates each analyte into its own peak, and the method can include separate calibration curves for each, provided resolution and detector selectivity are adequate to distinguish all target compounds.
Is the analyte always the largest peak on the chromatogram?
No. The analyte is defined by your analytical goal, not by peak size, and in complex matrices, the largest peak often corresponds to a matrix component such as a solvent, an excipient, and endogenous compound. Many regulated methods actually target low‑level impurities or trace contaminants, so the analyte peaks may be much smaller than those of major matrix constituents yet still be the most critical peaks to monitor and quantify.
Does the analyte change depending on the analytical goal?
Yes. The same chromatographic run can be repurposed for different objectives where the analyte definition shifts from a parent drug to a metabolite, degradation product, impurity, and counterion depending on the question being asked. In method development and validation, you explicitly define which peak or peaks are considered analytes for identification and quantification, and all parameters, such as analyte detection chromatography, calibration, and acceptance criteria, are built around that definition.
Why is sample cleanup important in LC-MS?
Cleanup removes matrix components that can suppress ionization, increase background noise, contaminate the source, and reduce reproducibility. In routine work, better cleanup often means better sensitivity, fewer maintenance interruptions, and more reliable quantitation.
What are the applications of LC-MS?
LC-MS applications span pharmaceutical research, clinical analysis, metabolite studies, product characterization, and other analytical tasks that require sensitive and selective measurement. In practice, food and environmental samples are often prepared using QuEChERS or similar multi-residue workflows; clinical and bioanalytical samples typically rely on protein precipitation, SPE, or SLE with additional phospholipid removal; and pharmaceutical or metabolite studies frequently use SPE- or LLE-based cleanup tailored to the specific matrix and analyte chemistry.
References
- StatPearls. (2024). Chromatography. NCBI Bookshelf. National Library of Medicine. https://www.ncbi.nlm.nih.gov/books/NBK599545/
- Kelly, M. T. (1991). Factors affecting the separation of organic compounds by gas–liquid chromatography. (Master’s thesis, University of Cape Town). University of Cape Town OpenUCT. https://open.uct.ac.za/server/api/core/bitstreams/a205ec1b-7b5c-44e7-89e2-a55a79cc149c/content
- Banaras Hindu University. (2020). Separation of molecules by chromatographic techniques. BHU teaching material. https://www.bhu.ac.in/Content/Syllabus/Syllabus_300620200409084143.pdf
- Jemal, M., Xia, Y. Q., & others. (2018). Matrix effects in quantitative LC–MS analysis. Bioanalysis, 10(17), 1223–1245. https://www.ncbi.nlm.nih.gov/pmc/articles/PMC6100609/
- WuXi AppTec. (2025). Internal standards in LC–MS bioanalysis: Which, when, and how. WuXi DMPK Services. https://dmpkservice.wuxiapptec.com/articles/404-internal-standards-in-lc-ms-bioanalysis-which-when-and-how/
- Desrosiers, N. A., & Huestis, M. A. (2017). Ultra-high performance liquid chromatography tandem mass spectrometry method for cannabinoids in human specimens. Journal of Analytical Toxicology, 41(2), 121–129. https://pmc.ncbi.nlm.nih.gov/articles/PMC5697720/
- Brazilian Journal of Pharmaceutical Sciences. (2017). HPLC method development in pharmaceutical analysis. Brazilian Journal of Pharmaceutical Sciences, 53(3), e00012. https://www.scielo.br/j/bjps/a/38n6jXHm9mFYSMBgJxbxDQm/?lang=en&format=pdf
- Balazs NanoAnalysis. (2023). Calibration, uncertainty, and recovery in the chromatographic sciences. Balazs Technical Note. https://www.balazs.com/sites/balazs/files/2023-03/pub0064-chromatographic-sciences.pdf
- Holzgrabe, U., Deleers, M., & others. (2004). Wide concentration range investigation of recovery, system precision and repeatability of an HPLC assay. Journal of Chromatography A, 1050(2), 163–170. https://pubmed.ncbi.nlm.nih.gov/15358314/